Mar 19
This is my fifth DrupalCon monitoring session submissions. My fifth time nervously counting the submissions as they come rolling in, first at a trickle, maybe 20 in a week. Then stagnation, followed by a bit of a panic - did we remember to tell people??
And then suddenly, the week sessions close, the sessions come pouring in like a flood. In just this last week, submissions increased nearly 400%.
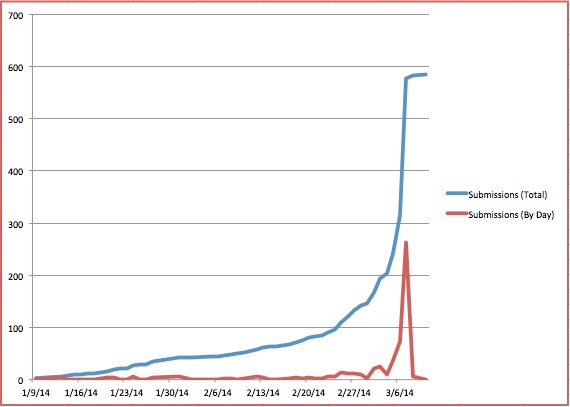
If you’re into data, as I am, I invite you to take a look at the juicy tidbits and nifty data points I’ve pulled out of the 584 sessions submitted to the site.
Special thanks to Tim Plunkett for pointing out how oddly fascinating DrupalCon stats can be.
**What other kinds of data do you want to see? Most repeated word?
Comments
I'd like to see some data on the submitters...
These are pretty cool infographics, and actually really informative. The buzz and the level are particularly interesting to me. It might be cool to see, of the submitters, for example, how many filled out their profile on the conference site, what line of work they find themselves in, how many of them feel confident in their presentation skills, stuff like that. NOT for purposes of making them uniquely identifiable of course, but just to get an idea of the complexion of the people who will be at the front of the room.
Those are interesting data points
I could probably pull some interesting stats for the speakers after they've been determined. At this point, given the questions we asked during the open call, a lot isn't easily quantifiable.
Speaking comfort level - speaker history? 1 time, many times?
Completed profile - new speakers versus known?
Line of work - by job title or role?
Core conversations
I assume core conversations have a later deadline? I can't believe that we don't want to have any core conversations!
There are 16 core conversations sessions
And a blog post where we mentioned the earlier deadline :)
https://austin2014.drupal.org/news/last-call-drupalcon-core-conversation...